What is the Difference Between Single Entry System and Double Entry System?

Difference Between Single Entry System and Double Entry System

A company could record its financial transaction using a single entry system or double entry system of accounting. Single entry system is less time consuming and less laborious while double entry system requires a lot of time and effort.

Definition of Single Entry System

The single entry system is the earliest technique of keeping financial records. An entry is made for each financial transaction, while the opposite entry is not made as the transactions are recorded once. It generally tracks the deals regarding cash invoices and disbursements (Also see Accounting – Accrual concept).

This approach of keeping records is mostly used by sole proprietorship and partnership companies. This system does not require high expertise and knowledge to enter transactions. Trial balance, ledgers and journals are not made for this. Nevertheless, the income statement is prepared to understand the profit or loss of the company.

Reconciliation of accounts is impossible because of some drawbacks such as one-sided entry. Hence, the possibility of mistakes and frauds is maximum. That is why it does not comply with the Financial Reporting Standards (FRS). Also, accounting records kept under this system are not ideal for tax purpose (Also see Tax Avoidance and Tax Evasion).

Definition of Double Entry System

Double Entry System is the scientific approach of maintaining financial records, created in 1494, by Luca Pacioli. This system is based on the concept of duality; each transaction has a dual aspect. Every transaction impacts two accounts at the same time, where one account is credited while the other is debited.

For instance, Mr A has bought products of S$1,000 for cash from Mr B. He has acquired products, and the money is provided to Mr B. As you can see, the goods are obtained by giving up money. Thus, this system records both aspects of a transaction, the increase in goods results in the decrease in cash.

Because of two-fold impact, the system possesses accuracy, completeness and fulfils the Financial Reporting Standards (FRS). A complete procedure is followed to record the transactions. The procedure begins with source documents, followed by the ledger, journal, trial balance; then financial statements (Also see What is an Income Statement?) are prepared.

Conclusion

An individual with little accounting knowledge could keep records according to the single entry system. However, the double entry system has developed because of some drawbacks in the single entry system.

You may reach out to any accounting services in Singapore to help you in managing your business’s accounting.

What is a Chart of Account?

What is a Chart of Account

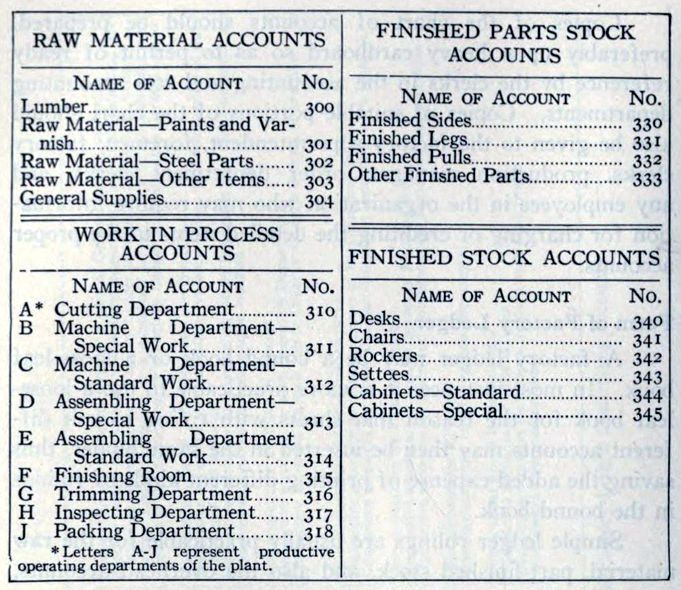
The chart of accounts is a list consists of all accounts that are used in the company’s general ledger. The accounting software application will use the chart of accounts to arrange information into the company’s financial statements such as the Balance Sheet and the Profit and Loss. The chart is arranged in order according to the account numbers so that it is easier to locate certain accounts. The account numbers could be numeric or alphabetic, or both, alphanumeric.

Usually, the accounts are arranged in order in the financial statements, start with the balance sheet and next, the income statement (Also see What You Need to Know About Record Keeping). Therefore, the chart of accounts begins with cash, continues with liabilities and shareholder’s equity, then proceed through accounts for revenues and expenses.

Numerous companies have structured their chart of accounts to enable the expenditure info is separated according to the different department; therefore, the engineering department, accounting department, and sales department would have the same expense accounts set. The setup of the chart of accounts depends on the requirements of the specific business.

Accounts in the chart of accounts:

  1. Assets:
  • Cash (main bank account)
  • Cash (payroll account)
  • Marketable Securities
  • Petty Cash (Also see Importance of a Petty Cash Book)
  • Allowance for Doubtful Accounts
  • Accounts Receivable
  • Fixed Assets
  • Prepaid Expenses
  • Accumulated Depreciation
  • Inventory
  • Other Assets
  1. Liabilities:
  • Notes Payable
  • Accounts Payable
  • Taxes Payable
  • Accrued Liabilities
  • Wages Payable
  1. Shareholders’ Equity:
  • Retained Earnings
  • Preferred Stock
  • Common Stock
  1. Revenue:
  • Revenue
  • Allowances and sales returns
  1. Expenses:
  • Bank Fees
  • Cost of Item Sold
  • Payroll Tax Expense
  • Advertising Cost
  • Supplies Expense
  • Utility Cost.
  • Depreciation Cost
  • Rent Cost
  • Wages Cost.
  • Other Expenses

Best Practices for Chart of Accounts

  1. Reduce the size of the accounts.

Examine the account list regularly to check if there are irrelevant quantities in the accounts. If so, and if these details are not required for unique reports, close down these accounts and roll the kept information into a bigger account. Doing this regularly could reduce the number of accounts so that it is easier to manage them.

  1. Consistency.

It is essential to produce a chart of accounts that would probably not change for the next few years, as you can compare the results of the same account over a few years. However, if you begin with a little number of accounts and then

If you start with a small number of accounts and after that slowly increase the number of accounts, it would end up being very difficult to get comparable financial details for more than the previous year.

  1. Lockdown.

Do not let subsidiaries to alter the standard chart of accounts without significant reason. This is because it would be harder to consolidate the outcomes of the business if you have numerous versions.

If you still have any queries about the chart of accounts, do not hesitate to get an accounting service in Singapore for more guidance for your company.

The Balance Sheet and the Profit & Loss Account

The Balance Sheet and the Profit and Loss Account

The Balance Sheet

A balance sheet is a financial statement that reveals an entity’s financial position at a provided date. It has two head columns which are to be tallied. They are assets and equity as well as liabilities.

For assets, it shows the current and non-current assets of a company. The current assets are properties that could transform into cash in one year, consists of cash, debtors, stock, money at the bank, valuable securities, and so on. Non-current assets have two categories — tangible and intangible assets (Also see Accounting for Goodwill). For tangible assets, they are the company’s physical assets, like building, equipment, land, vehicles, and so on. On the other hand, intangible assets are the non-physical properties of the business, for example, trademark, patents, goodwill, and so on.

On the equity and liabilities section, it shows the shareholder’s fund, non-current and current liabilities. Shareholders fund consists of the shareholder’s equity and reserves. Current liabilities are liabilities that should be paid in one year and consists of short-term loan, bills payable, creditors, and so on. Non-current liabilities are liabilities that should be paid after a duration and consists of bonds, long-term borrowings, and so on.

The Profit and Loss Account

The profit and loss account is also called an income statement. The account shows the company’s financial performance in a specific duration.

The net sales are recorded using accrual concept when the expense of products sold is subtracted, and the outcome is the gross revenue of the company. Now from these gross earnings, the workplace and administration, including insurance, rent, stationery, selling and distribution (bad debts, carriage outwards) costs are lowered, which totals up to operating profit (Also see Investor Ratios in Financial Statement).

After calculating operating profit, operating income is added while the operating costs are reduced, which leads to the net earnings or loss. If the earnings go beyond expenditures, this shows that net profit while the expenditures exceed earnings, it represents a loss (Also see Employ Accounting Service To Prepare Financial Statements).

You may engage our accounting service in Singapore for more information on the difference between the financial statements.

Basics on Balance Sheet

Basics on Balance Sheet

A balance sheet offers an overview of a business’s financial status of a particular time. It tells you about the business’s assets, liabilities, and capital. The assets need to be equal to the total of the liabilities and the business’s equity from shareholders.

The purpose of a balance sheet is to identify the financial strength of the company (Also see The Balance Sheet and the Profit & Loss Account). It tells you how stable, financially, your company is. Regularly, you will discover yourself depending on the balance sheet when making a decision and in preparation of other financial statements.

What Are Assets?

Assets are the properties owned by your company. There are two classifications of assets: current assets and long-term assets. The cash in your company is described as the current asset due to high liquidity. Since machinery and other properties like real estates take a longer duration to liquidate, they are counted as long-term assets. Other examples of current assets are account receivables and cash on hand (Also see What Is Cash Flow?). These assets usually are transformed to cash in one fiscal year.

Fixed assets depreciate over time. For instance, machinery and buildings tend to lower in worth with time. Some assets, such as land increase its value with time. The typical types of fixed assets in a company are the machinery, vehicles and workplace equipment. None of these is easily convertible to cash within one fiscal year of the company.

What Are Total Assets?

The total assets of a company are when you add all the current and fixed assets your business owns. This is what you need to record and report on your balance sheet. The quantity you receive does not represent the current fair market price, but the purchase cost of the assets.

Owners’ Equity and Liabilities

Liabilities are the company’s obligations to the outside world. Owners’ equity is the amount when you deduct the debt quantity from the total assets. These liabilities and debts are to be paid in one year for short-term liabilities or after one year for long-lasting liabilities. For example, the debts from creditors and suppliers’ accounts, accrued wages, accounts payable, shareholders deposits and income account payable.

A balance sheet is a crucial financial statement that usually prepared by accounting firm in Singapore. The balance sheet reveals the business financial position at a specific time. Hence, you need to guarantee that it is made correctly, and you may look for any accounting services in Singapore for further guidance.

Investor Ratios in Financial Statement

Investor Ratios in Financial Statement

An investor needs to know how to analyse the investor ratios when assessing the financial statements of a company (Also see Getting Ready as An Ambitious Accountant). Investor ratios could be used to determine the health of a business as it can show whether it is a good investment or bad investment.

When a business makes profits, the directors have two options to manage these profits – to reinvest profits or pay dividends. Some investors are searching for development, whereas some investors are searching for a good yield. Some investors are willing to give up short-term profits as they desire to increase the share price to make profits. Below are a few investors ratio that you need to understand:

Earnings Per Share (EPS)

EPS = Net income-Preferred Dividends / Weighted Average Shares Outstanding

This ratio indicates that the profit shown in Profit and Loss that could be paid investors in theory. From EPS, we can determine whether the EPS of the business under consideration is constant, reducing or growing.

Earnings per share are simple to comprehend, and figures are available. However, a research study has revealed that there is a poor connection between shareholder value and earnings per share growth.

Dividend Per Share (DPS)

DPS = Annual Dividends / Weighted Average Shares Outstanding

Annual dividends consist of total dividends paid by an organisation in one year, including interim dividends but excluding special dividends.

Investors used DPS to evaluate various entities to invest in. However, DPS ratio might not show a complete image and position. Some companies might keep their profits for future investments, instead of paying dividends to current investors. By doing so, the company can boost the value of their shares and the general worth of the business.

Dividend Yield

Dividend Yield = Dividend Per Share / Current Share Price

This ratio shows the percentage return made by an investor regarding the company’s current share price. Investors would have an interest in the dividend yield as they desire returns or good yields from their investment. Dividend yield benefits the investors as it can be used as a comparison with other financial investment chances.

Dividend Cover

Dividend Cover = Profit After Tax – Preference Dividends / Dividends Paid

Dividend cover measures a company’s ability to pay dividends. It tells us how many times over the profits of a company could pay the dividends. For instance, if a company’s dividend cover is 3, this indicates that the company’s profit was thrice the number of dividends paid to shareholders. Usually, the objective of an organisation is to maintain a dividend cover of 2 to obtain enough funding from retained earnings and to offer a reasonable return to the shareholders.

There are lots of accounting service in Singapore you can seek help from if you need further assistance in understanding financial statement.